Example
Design
From the Project Explorer, under the Distribute section, select XML Designer. From the menu, select File, Open Template… and open the workbook Water Distribution.xlsx located in the Input folder of the project.
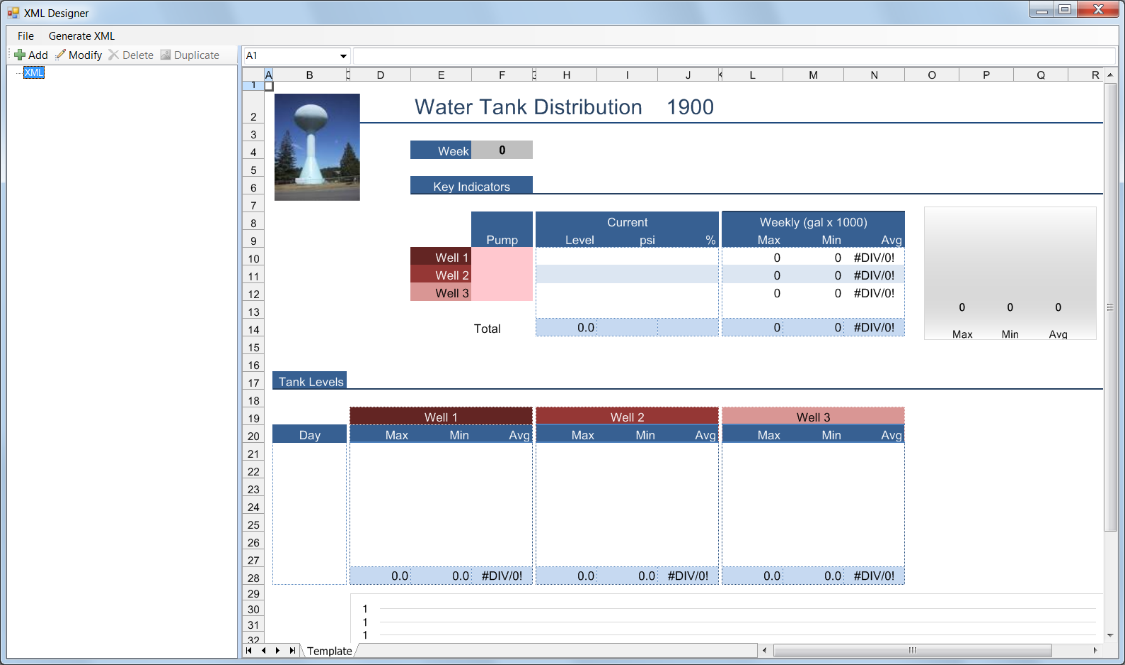 |
The XML structure is usually designed with an understanding of how the worksheet content will appear in XML. In our example, we will use the singular values such as the week number in $F$4 and the tabular Tank Level values for each well starting in row 21.
In the left pane, highlight the root element XML and click Modify. The root node supports comments.
For Comment enter Water Distribution XML
Click OK
With the root element highlighted click Add
 |
Set the Name to Distribution
Click OK
This will create a child element of the root.
Select the Distribution element and click Add
 |
Set the Name to Distribution Date
Check Child Node
Click OK
Select Distribution Date element, click Add
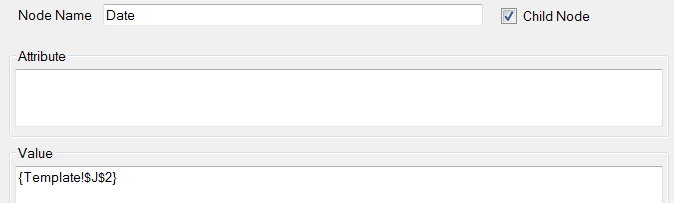 |
Set the Name to Date
Check Child Node
Set the Value to {Template!$J$2}. This can be done by placing the cursor in the Value field and selecting the cell on the worksheet.
Click OK
Select Date element, click Add
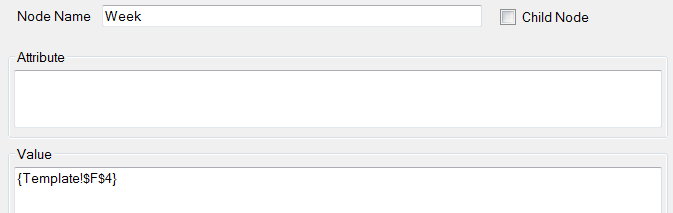 |
Set the Name to Week
Set the Value to {Template!$F$4}
Click OK
At this point select File, Save from the menu to see the structure of the XML file with the cell references selected.
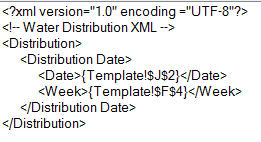 |
When the XML is produced, the cell references will be replaced by the values of the report.
Click the red X to close the XML and view the template again.
We now turn our attention to the tank levels. We will arrange this information in the XML by creating an element for each well and setting child elements to represent the data.
Highlight Distribution Date in the left pane, click Add
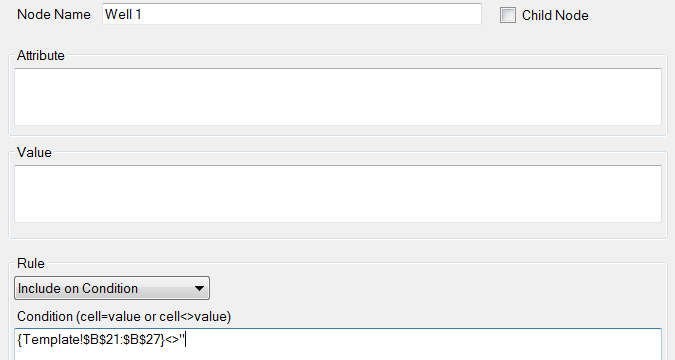 |
Set the Name to Well 1
Set the Rule to Include on Condition
Set the Setting to {Template!$B$21:$B$27}<>’’
Click OK
The rule is configured to a range of cells which are tested to be non-blank. For a non-blank cell, all of its children are sent to the XML output adjusted by the row of the non-blank cell.
Configure the 4 child elements Day, Max, Min, and Avg
 |
For the Value use {Template!$B$21}, {Template!$D$21}, {Template!$E$21} and {Template!$F$21}.
We will repeat for the configuration of Well 2 and Well 3 elements in a similar fashion to Well 1.
Highlight Well 1
Click Duplicate and rename to Well 2
Update the Max, Min and Avg to {Template!$H$21}, {Template!$I$21} and {Template!$J$21}.
Repeat for Well 3 with $L$21, $M$21 and $N$21.
Click File, Save

Validate
The XML file can be generated manually from the designer.
Select the menu option Generate XML. This opens a dialog for a report name.
 |
Click the browse […]
In the Reports folder, select the file 2022\Oct\Water Distribution - Week 41
Click OK
This will display the XML file generated. The XML file will be in the same folder as the report.