Square Range
The Square Range function inserts additional rows of data into tabular data in order hold the value of the tag until the next sample.
For example:
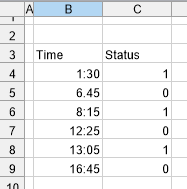

Note that the value at 1:30 is added to the table with the timestamp 6:45 (next sample). This continues with all the samples in the table.
When the Square Range management function is applied to charts, it will smooth out the peaks and valleys which would be shown if the data had not used this function. The most effective chart type to use for this management function is an XY scatter chart plotting time on the X axis.
Example
As an example, here is a report with the daily run status of a machine and a chart.
 |
It is hard to determine from the chart the time period when the machine was running and when it was not. Now, with the Square Range management applied to the data ($B$4:$C$4), the chart is transformed.
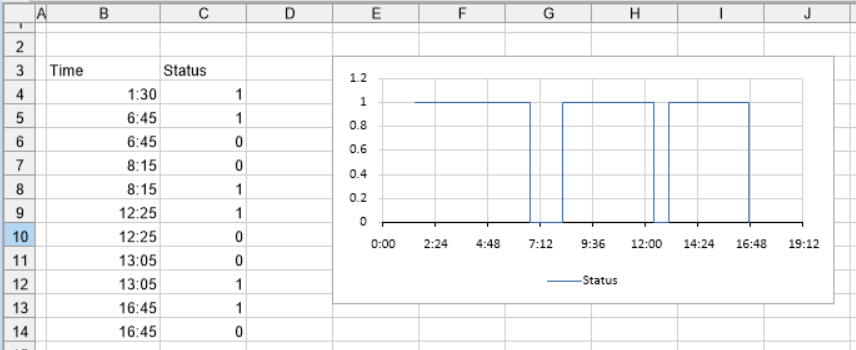 |
Settings | |
|---|---|
Apply To | The Apply To range is the only setting required for this function. This determines the range over which the function is applied. The timestamp (or whatever is used for the x-axis) is assumed to be the leftmost column of the range and every other column to the right is assumed to be a data series in the chart. |