Predefined Templates
When an alarm management connector is created, a set of predefined templates are automatically added to the current project. These templates are fully functional but will limit their output if a full license is not present.
AlarmReport
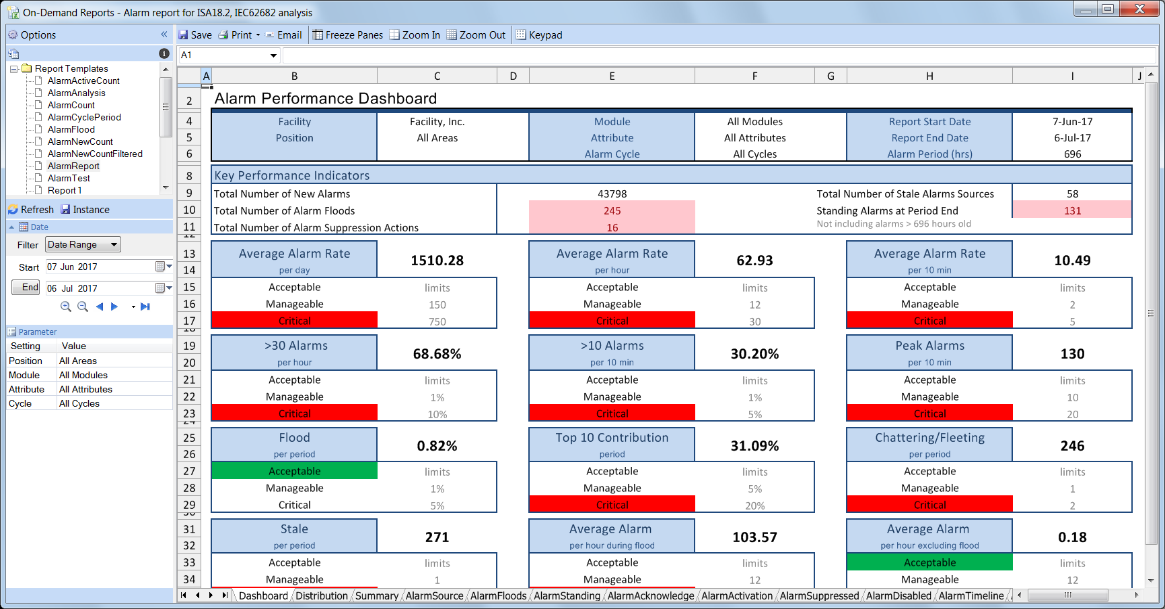
The AlarmReport is a comprehensive multi-sheet report that displays alarm analysis described in ISA-18.2 standard. A dashboard is the first provides an “at-a-glance” view of the alarm system and the other sheets provide detailed information that support the KPIs.
A report is produced on-demand by specifying settings for the Start/End dates, Position, Module and Attribute. In the case of Position, Module and Attribute, they need to be setup in the Alarm Connector in advance (see Connector).
Enter input settings and click Refresh.
 |
Note that in trial mode only the Dashboard and AlarmSummary reports are displayed.
Dashboard
The report shows the compliance metrics as a dashboard together with the recommended limits (which can be modified in the template). Each metric is rated according to the limits and color coded for easy detection of non-compliance.
Alarm Summary
The report shows the primary KPIs and metrics performance indicators. It also shows the distribution of the new alarms by configuable group levels for each day in the report period. For the most active day, the distribution is shown by hour.
Alarm Source
The report shows the sources of new alarm activity in descending order of alarm occurance (bad actors). The top 20 most active alarms are shown in a pareto chart to determine the percentage effect of the active alarms to the whole.
Alarm Floods
The report shows the occurrence of each alarm flood as sdefined in the template. By default, a flood starts with more than 10 alarms in 10 minutes and ends with less than 5 in 10 minutes. The report also shows the peak of the flood and the total new alarms that occurred during the flood.
Alarm Standing
The report shows the alarms that are active at the end of the report period.
Alarm Acknowledge
The report shows a summary of the alarm acknowledgement time. The metrics are based on the time taken for an active alarm to be acknowledged.
Alarm Activation
The report shows a summary of the alarm activation time. The metrics are based on the time taken for an active alarm to become inactive.
Alarm Suppressed
The report shows a list of alarms that are suppressed during the alarm period. Note that this is not supported by every alarm system. An indicator shows if they are in that state at the end of the period.
Alarm Disabled
The report shows a list of alarms that are disabled during the alarm period. Note that this is not supported by every alarm system. An indicator shows if the alarms are in the disabled state at the end of the period. In this scenario the final disabled alarm message is not considered in the overall count.
AlarmAnalysis
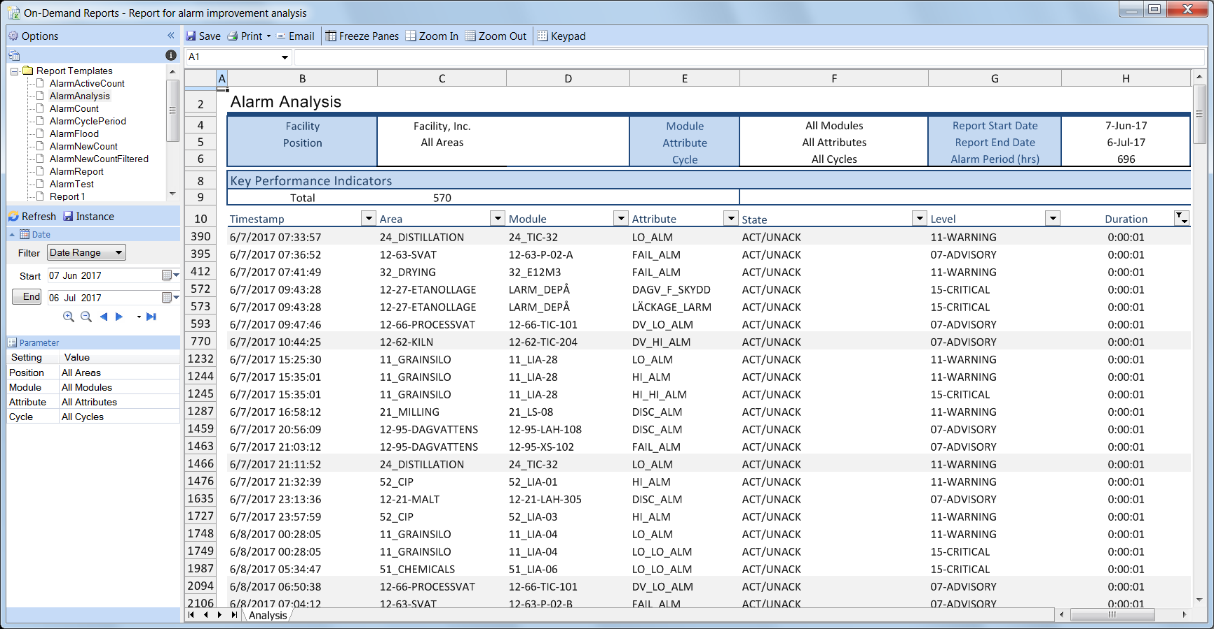
The alarm analysis report is a powerful environment to understand alarm behavior. It is primarily used to determine and track alarm details in order for effective diagnosis and repair.
 |
Note that in trial mode only the first 50 rows of data are displayed.
The report shows every new alarm occurrence and the duration of how long it was active. By using the Duration column filter alarms with short alarm activity (chattering) and long alarm activity (stale) can easily be detected. By combining this filter with Level column, critical alarms on a short alarm cycle can be determined.
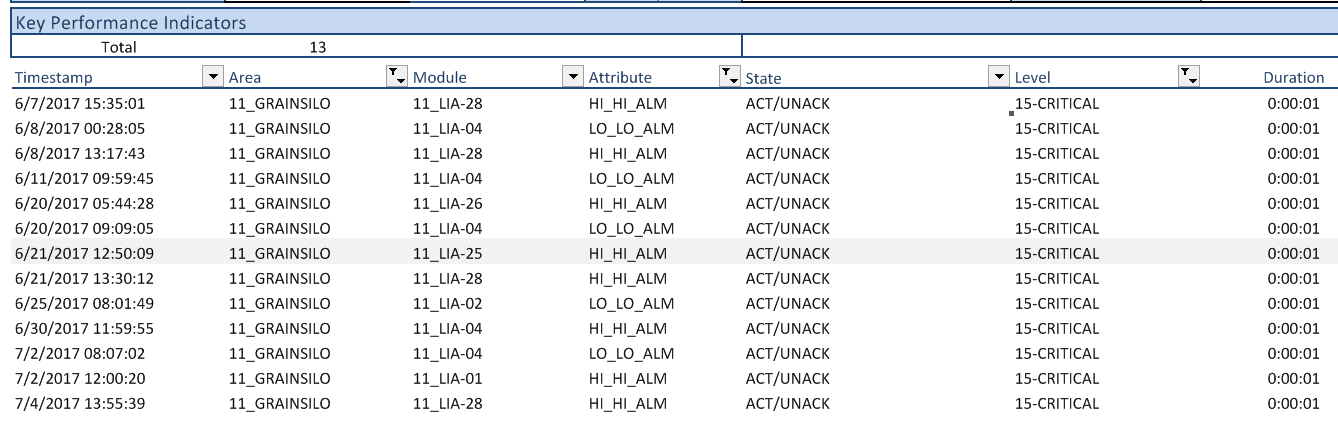 |
In the above, there were 13 occurences of critical alarms in the 11-GRAINSILO area initiated from the modules 11_LIA_01,_02,_04,_25,_26 and 11_LIA_28.
AlarmFlood
The alarm flood report allows further analysis of the flood activity presented on the Alarm Floods subreport in the Alarm Report.
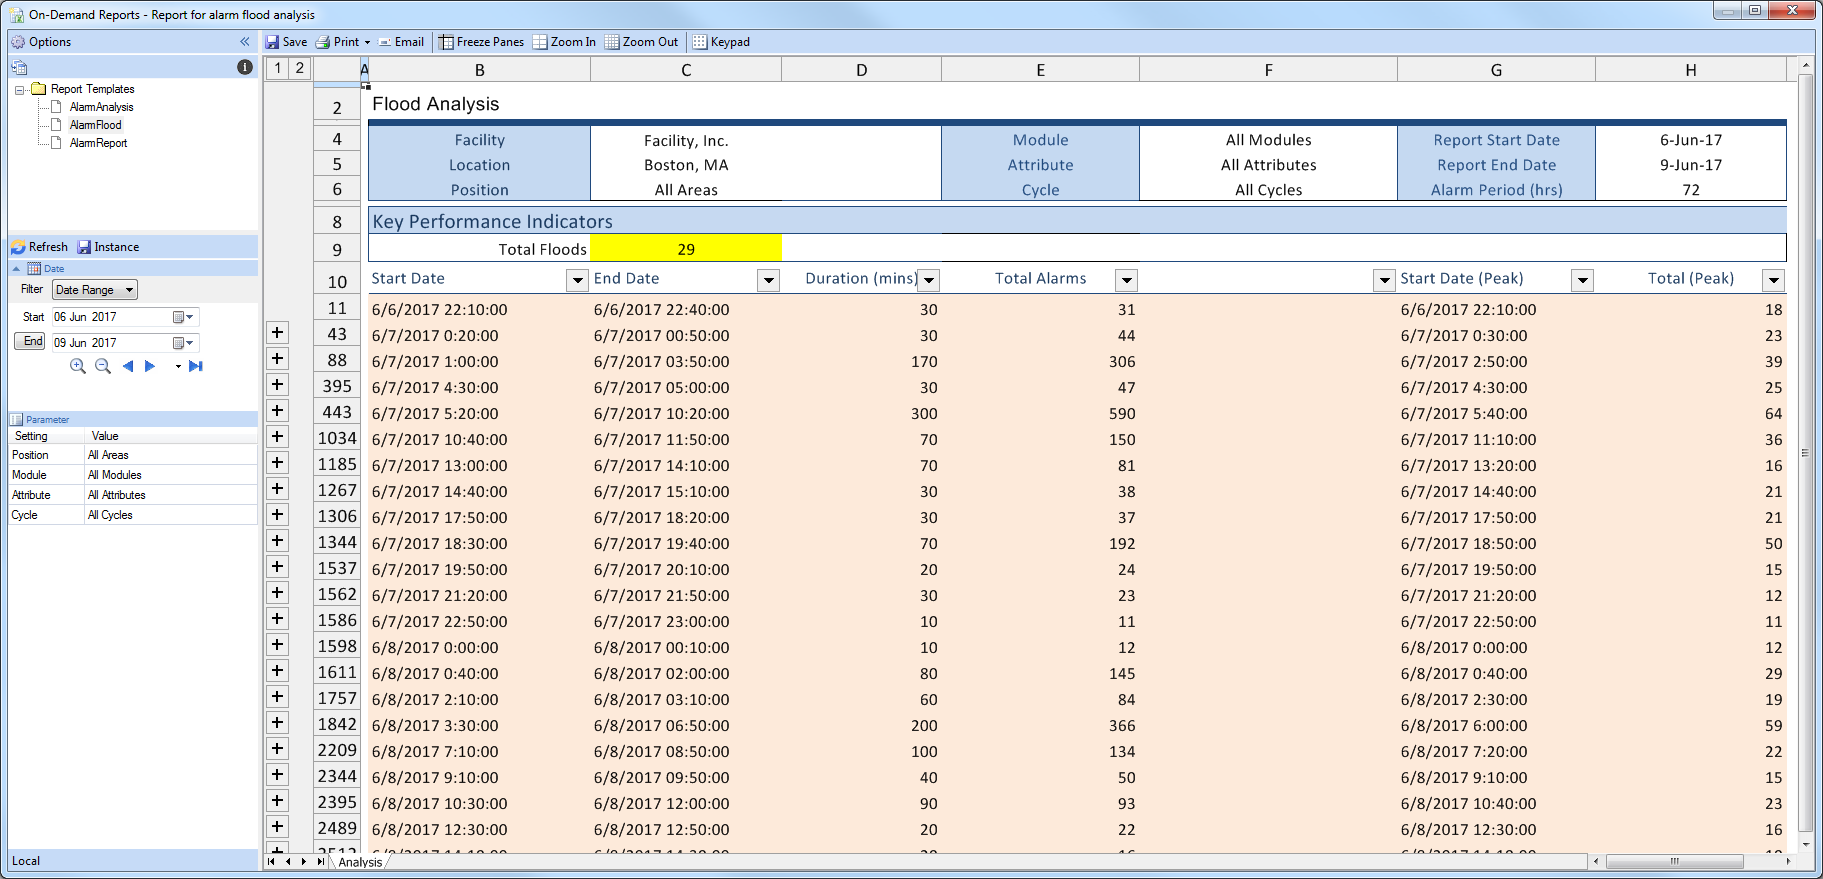 |
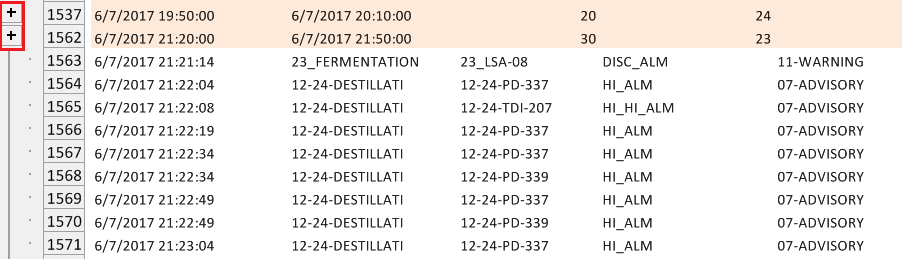
Each row indicating a flood is collapsed by default and is expandable to show individual alarm attributes that were activated during the flood.
 |
Note that in trial mode only the first 20 flood occurrences are displayed, and only the first 20 rows of flood details are displayed.