Connector
To configure the connector, from the Project Explorer select Connect, Connectors.
Click Add
Select Database (time series), Historical values (narrow time array)
Click OK
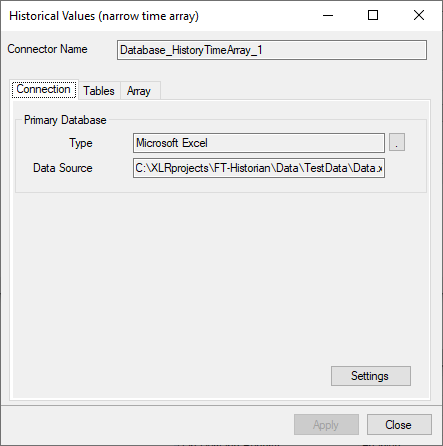
The connector contains 3 tabs: Connection, Tables and Array
Connection tab
On this tab the Primary Database specifies where the tables are located. A browse button […] is provided to define. If there are issues connecting to the database, please refer to the section in the Database Connectors document on the specific database.
Tables tab
On this tab, information about the tag and data tables is provided.
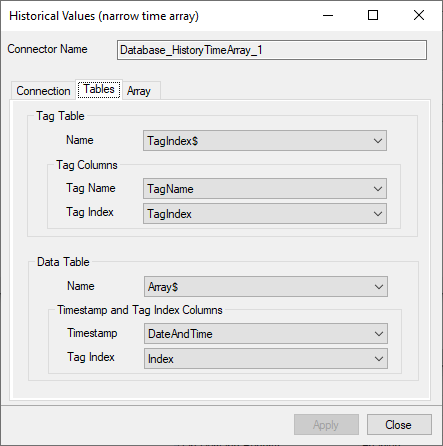 |
Under Tag Table the table Name and the columns representing the Tag Name and Tag Index are specified.
Under Data Table the table Name and the columns representing the Timestamp and Tag Index are specified.
Array tab
On this tab, information on the data columns and how the data is arranged in the Data table is specified.
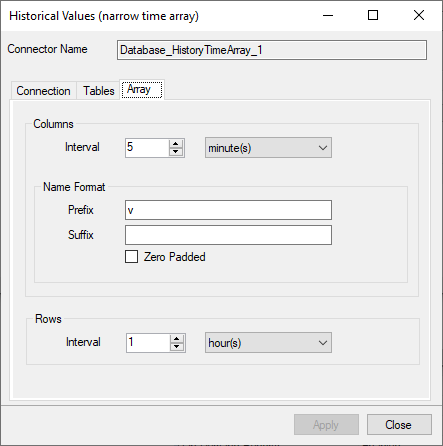 |
Under Rows is the frequency of when a new record is added to the table e.g., 1 hour.
Under Columns, the interval indicates the logging frequency of each tag. Considering the row and column frequencies together, the number of data columns is expected e.g., new row every hour with a logging frequency of 5 minutes results in 12 columns.
The column names are a zero-based numeric sequence that can contain a Prefix, Suffix and zero pad. By default, the column naming is 0, 1, 2, and so on.