Condense Range
The Condense Range function condenses a table of data based on a column and a Group Method.
Settings | ||
|---|---|---|
Group | The cell that defines the column within the Apply To range used to condense the data in the other columns. | |
Group Method | The method by which to group the data in the Group column. The Group column can contain text, numbers, or timestamps. Text can be grouped with or without case sensitivity. For numbers, grouping can be done on the Cell Value or the Cell Text (case is not considered here).
For example, if the Group column has the values 2.11 and 2.12 and formatted for 1 decimal place, Cell Value would treat these as different whereas the Cell Text would treat them the same. For timestamps, the Group Method can be Second, Minute, Hour, Day, Month or Year in multiples of the Interval. | |
Condense To | This defines how to condense the data in the columns in the range outside the Group column. The following options are available:
| |
Interval | This setting can be a fixed number, a variable, or a single cell reference. If Interval does not evaluate to a number, it is set to 0. The value of Group Method and Interval influence how the grouping is performed. | |
Cell Value
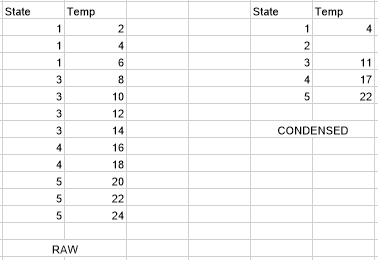
| ||
Cell Text
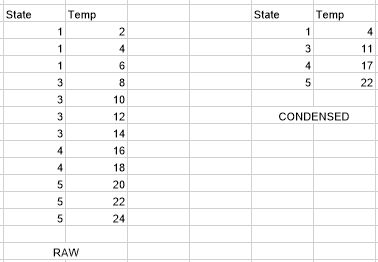
Rows are condensed for each unique displayed value in the Group column. | ||
Time Based
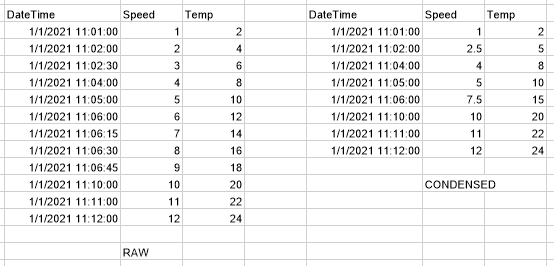
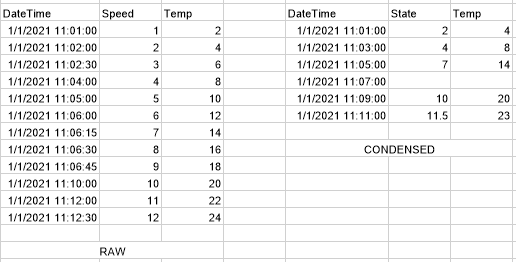
In the above example, the raw data is condensed to averages for each 2 Minute interval in the DateTime column. In the absence of data in the group, an empty record is displayed e.g., 11:07:00. | ||
Example
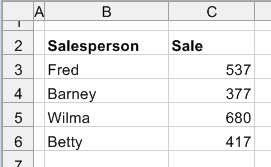
Consider the following table of data:
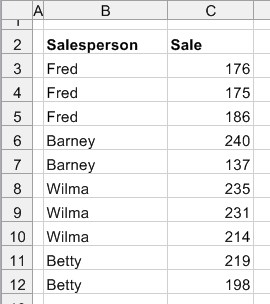 |
To calculate the total sales for each person, use the following settings:
Apply To | |
|---|---|
Cell | $B$3:$C$3 |
Direction | Down |
End | All cells are empty |
Setting | Value |
|---|---|
Group | $B$3 |
Group Method | Cell Text (Case Insensitive) |
Condense To | Total |
Interval | 0 |