Summary Values
Unlike the Text Historian, this connector only supports raw data retrieval. If summary values are required (like the Text Historian) then this is done within the workbook using provided features.
Summary Table (Placement)
If the requirement is to produce summary values over the entire text file, set the formula of the table to the top two rows where the data is to appear.
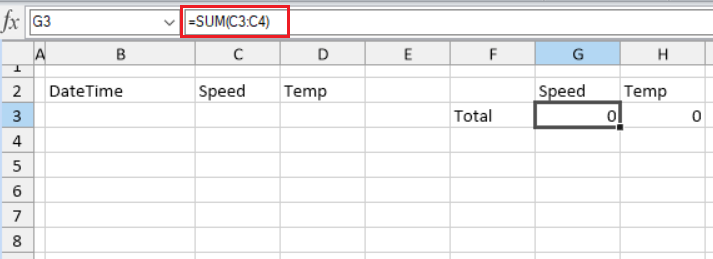 |
In Data connection set the Placement to Insert At Start or Insert At End.
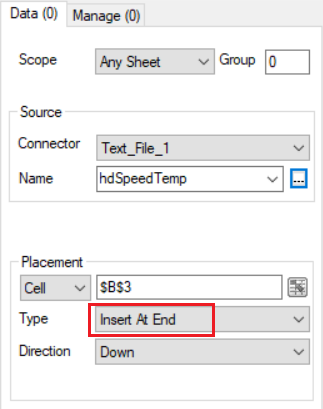 |
For more information on Data Connections and Placement, see the Data Connections document.
Summary Table- Formula Range
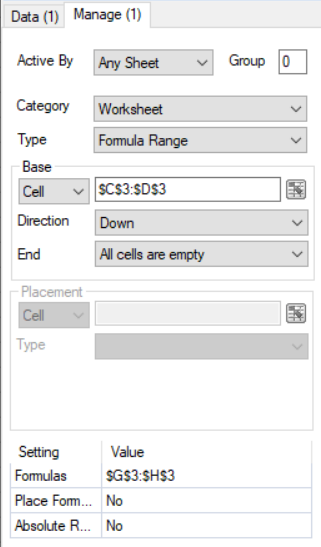
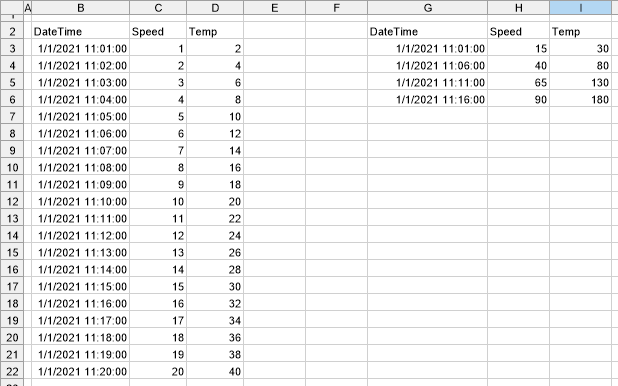
This approach is like the above in that in a worksheet in the template use formulas, but in this case set these formulas to the top row where data will appear.
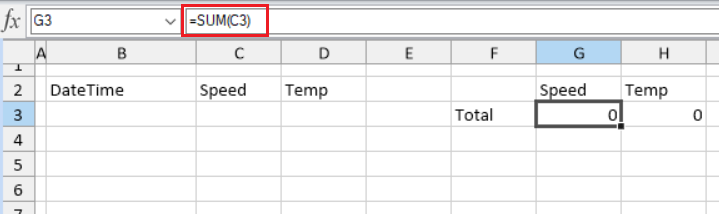 |
In Data connection set the placement to Direct.
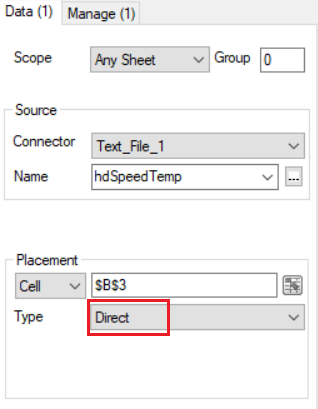 |
Use the Manage connection Formula Range to adjust the range of any formulas based on the amount of data.
 |
Summary Values – Condense Range
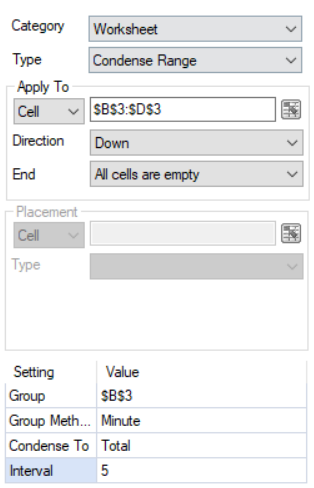
The Manage connection Condense Range is used to produce a summary of aggregates calculated over a specified Group Method. The method requires a column for the grouping process and then the grouping itself is numeric, textual or datetime.
 |
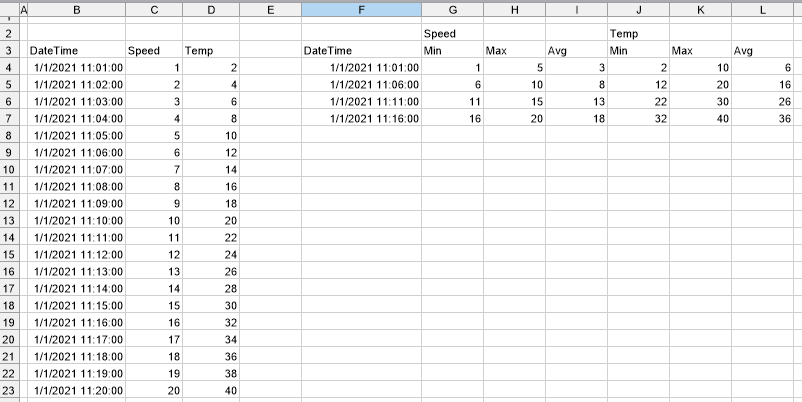
In the above example, the condensed range is derived by summing groups of 5 minutes.
 |
In practice the condensed range is placed in the same location as the raw data and is shown separately above for illustration.
Summary Values – Summary Range
The Management connection Summarize Range is used to produce a summary of aggregates using a row count (Interval) and specified worksheet formula.
 |
In the above example, the summary range is derived by statistics of 5 minutes
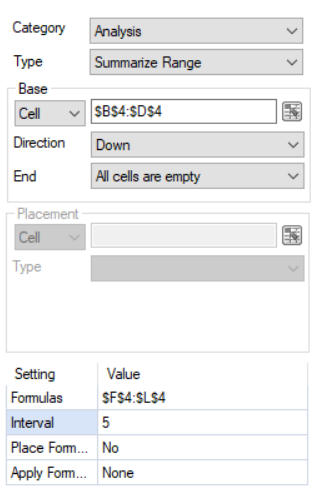 |
Note that the raw data can be cleared in the report when Place Formulas is set No.
For more information, please refer to Data Management documentation.