Set up C-more
Configure a Line Trend Graph Object
The Line Trend Graph is used, in addition to displaying trends on the HMI, to collect data in tab-delimited files (.txt).
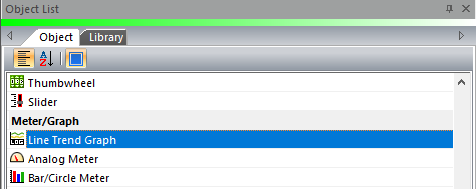
In the C-more Programming Software, place the Line Trend Graph Object on a display that cannot be closed by a user.
 |
General Tab
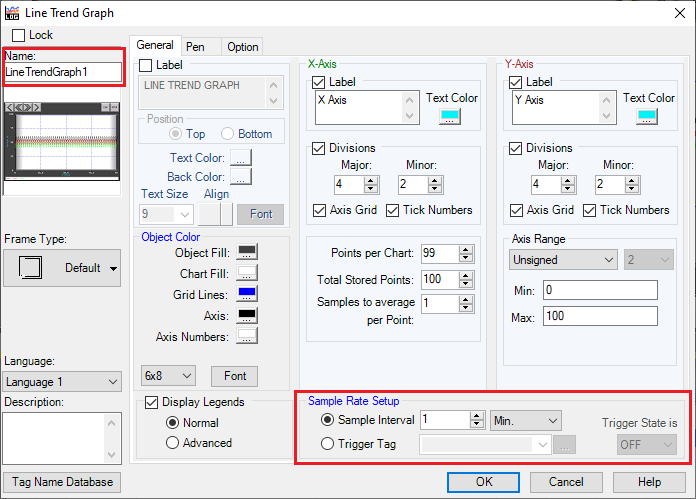 |
The General tab settings determine the logging behavior. To optimize reporting runtime, enable the following:
Set Name to reflect the data being logged to the file. This parameter is used to name the file set.
Configure Sample Rate Setup based on the reporting requirements. Higher resolution data produces more accurate summaries but reduces the performance at report runtime.
Pen Tab
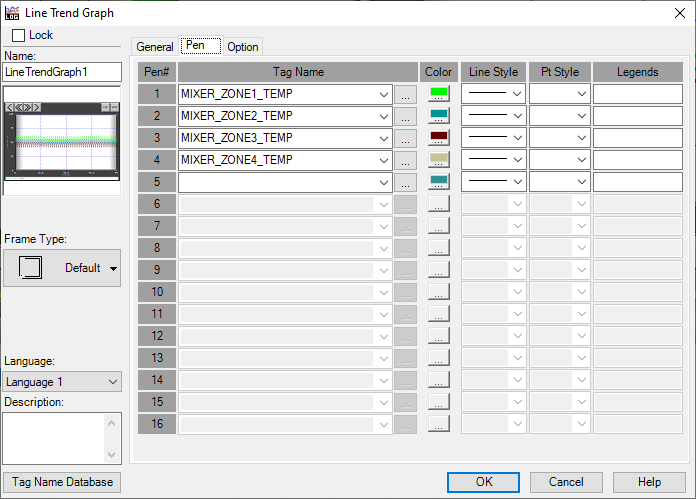 |
The Pen tab settings determine which tags connected to the C-more project are logged to the text files.
Options Tab
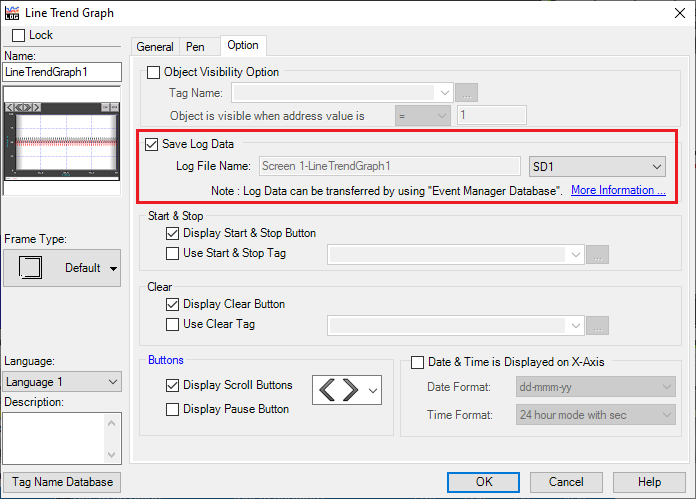 |
The Option tab settings determine where the csv files are saved.
Enable Save Log Data
Specify the location, e.g., SD1, SD2, USB
Configure FTP Server
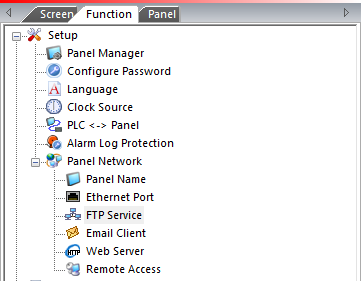
For FTP access, first enable the Ethernet Port from the Function menu. Then, enable the FTP Service. For more information on these functions, consult the documentation available in C-more Programming Software.
 |